
Understand
Context
While the platform supported detailed life cycle assessments (LCAs) for individual products, there was no way to aggregate and report on multiple assessments collectively. This created friction for sustainability consultants and in-house teams trying to deliver portfolio-wide insights efficiently.
Challenge
Create a portfolio-level reporting experience that blends technical accuracy with business readability, helping users communicate trends, trade-offs, and environmental impact clearly across assessments.
Define
Client Goals
Enable high-level environmental reporting across product or supplier portfolios
Reduce manual reporting tasks and ensure consistency
Equip users with a client-ready format that supports executive decision-making
Increase platform value for consultants and cross-functional teams
Primary Users
Sustainability Consultants creating external reports for clients
Environmental Analysts summarising performance across assessments
Procurement & ESG Teams tracking supplier-level environmental impact
User Needs
Deliver clear sustainability summaries without losing technical credibility
Identify and communicate key trends or hotspots across assessments
Save time while maintaining data accuracy and professionalism
Ideate
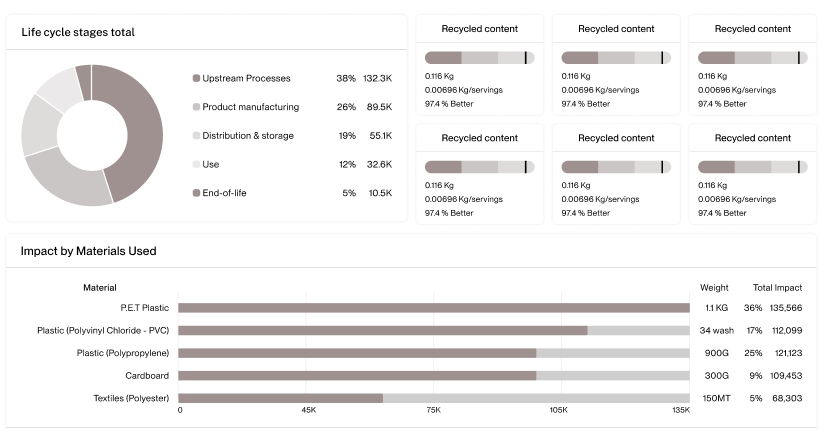
Solution Overview
Portfolio Summary Layout: A modular, structured view showing impacts and insights across multiple assessments
Assessment Selection Tool: Users tailor reports to their specific portfolio, sector, or client
Hotspot & Trend Highlights: Subtle indicators to draw attention to key differences or environmental trade-offs
Contextual Guidance: Built-in explanations and descriptors to support non-expert interpretation
Visual Consistency: Aligned with the core platform UI to maintain trust and ease of use
Design Considerations
Focused on legibility and hierarchy, avoiding heavy visualizations
Employed progressive disclosure to surface depth only when needed
Designed with mixed audiences in mind: technical analysts and executive stakeholders
Validate
User Testing & Iteration
Feedback sessions with consultants and in-house teams
Users praised the professional layout and clarity of summarised insights
Adjustments made based on feedback: improved visual hierarchy, clearer benchmark groupings, and inline descriptions
Impact Highlights
Manual compilation has reduced significantly
Improved team alignment through shared summaries
Clearer communication of sustainability hotspots and performance ranges
Deliver
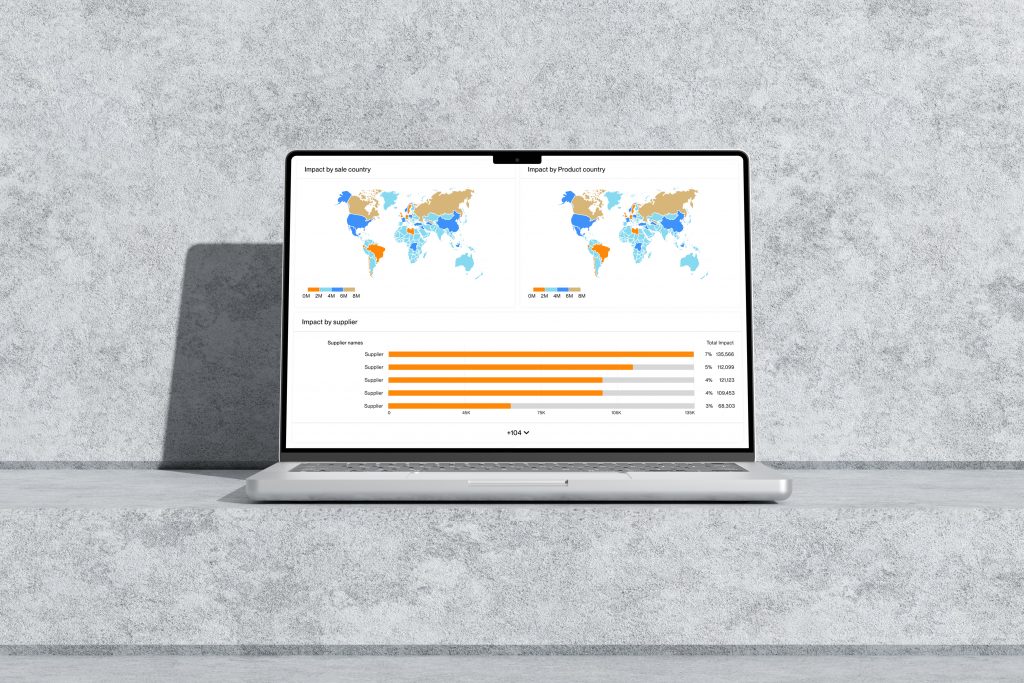
What We Delivered
Web-based portfolio reporting UI
Dynamic report builder integrated with assessment database
Modular, responsive layout compatible with PDF export and presentations
Design system components consistent with the core platform
Accessibility-compliant colour and typography
Cross-Functional Collaboration
Agile sprints using Jira and Teams
UX/UI aligned closely with developers, PO, and QA
Frequent iteration cycles based on stakeholder review and live feedback
Reflect
This feature unlocked a new layer of value for both consultants and enterprise teams, enabling actionable reporting at scale. By blending usability with environmental integrity, we helped users make faster, more confident sustainability decisions at the portfolio level.
Book a free 30 min call
Let’s have an honest conversation about what’s holding your product back. Whether it’s user friction, unclear priorities, or low engagement, we’ll help you unpack the issues


Copyright © 2025 | Afirix
Book a free 30 min call
Let’s have an honest conversation about what’s holding your product back. Whether it’s user friction, unclear priorities, or low engagement, we’ll help you unpack the issues
Copyright © 2025 | Afirix